This project developed a tool for evaluating and optimizing bus stop locations. In evaluation mode, it will determine the impacts of a proposed change in bus stop locations, adding or removing a stop. In optimization mode, it will select the optimum stop locations from a set of candidate locations (generally, all the intersections along the route).
Users of this prototype software will be able to specify the relative importance of walk distance, riding time, and operating cost. The tool will be realistic in accounting for transfer demand and demand arising along side streets that is more like point demand than like continuous demand. It will account for roadway and traffic parameters that affect stopping delays (grade, cruise speed, traffic control). While this project addressed urban bus routes in general, attention was paid to a planned bus rapid transit application and to a light rail transit case study.
Changing stop spacing has three predictable, quantifiable impacts: it affects walk access distance, riding time for through riders, and operating cost. While the mathematical relationship of these impacts to stop spacing was published 20 years ago, this knowledge has not been translated into practice because the mathematics was expressed in terms of data inputs that were not generally available. The concept in this project is to develop a software tool that will calculate the impacts of changing stop spacing, using generally available data—on/off counts and geographic data such as road maps and assessor’s maps.
There is a general awareness that part of what detracts from bus transit’s attractiveness is the frequency of stops. Urban bus routes in the U.S. typically have stops about 200 meters apart (8 stops per mile), compared with 320 or 400 meters in Europe (5 or 4 stops per mile).
Project Results
A mathematical model was developed for creating the demand distribution along a route from on-off counts and map data. This model results in a set of continuous and point demands that permit accurate estimation of access walk distance. Mathematical models were also developed for impact evaluation for a set of proposed stops and for optimization, using dynamic programming to find the set of stops with least overall societal cost. Recent refinements have included rider shed line formulas that differ depending on whether one is boarding or alighting, consistent with user travel time optimization, impact of grade and traffic control on delay impacts, and adjustments for evaluating and optimizing sections of a route instead of an entire route.
The first generation models have been programmed in Visual Basic in a Microsoft Excel environment and tested on an MBTA bus route in Boston for a single period and direction. The results show that the method is practical—it yields practical results using readily available inputs. Just as importantly, they show that improved decisions about stop location can yield significant benefits. In the example, the optimization recommended 19 stops on a route that now has 37 stops, changing the average stop spacing from 202 meters to 404 meters. While reducing the number of stops increases average walk access time by 0.6 minutes, it decreases average passenger ride time by 1.8 minutes and decreases one-way running time by 4.2 minutes—enough to save a bus without changing service frequency. This also reduces operating costs.
Figure 1 shows a comparison between existing stop locations and those recommended in our first generation study for MBTA bus Route 39. It also compares existing and optimal stop density along the route. It emphasizes the fact that the tool being developed recommends not only the spacing between stops, but their actual locations as well.
Completed Investigation
A second generation evaluation and optimization tool has been programmed using the C++ programming language. It includes several enhancements based on input from transit planners and from lessons learned in applying the method to different test sites. The investigators also plan to develop GIS modules to automatically generate geographic inputs from assessors’ maps.
The second generation tools were applied to transit routes at two transit agencies: a bus route of the Capital District Transportation Authority (Albany, NY) and a light rail transit of the Massachusetts Bay Transportation Authority in Boston. Feedback during the application stage was used to refine the tools to reflect available inputs and desired outputs.
Product Payoff Potential
The tool, when fully developed, could offer transit agencies an automated and accurate method of evaluating bus stop location decisions and rationalizing stop locations. It could be an important tool for Bus Rapid Transit route development, as well as for improving the efficiency of urban bus routes. By providing the technical support needed to justify stop rationalization, it can lead to making transit faster and more cost efficient and attracting greater ridership.
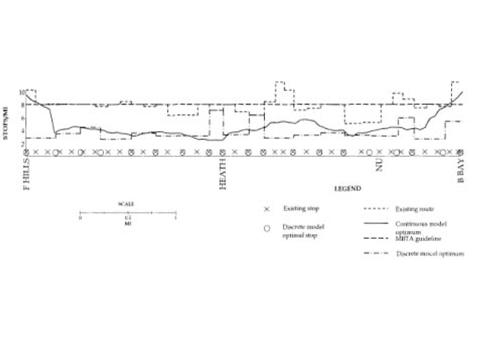
Figure 1
Comparison of existing and optimal stop locations and stop densities, MBTA Route 39.

